Introduction to Azure ThreadX & Debugging with TraceX | Renesas RA - 21
Published
Hello! With this tutorial we will start the long subseries devoted to using the real-time operating systems (RTOS) on the RA MCUs. The thing is that a lot of the high-level services provided by the FSP (like USB, Ethernet, FAT, graphic user interface (GUI)) only work within the RTOS. So if you want to use them in your project, you need to know at least the basics of an RTOS.
For now, Renesas RA MCUs have ports of two operating systems which you can select on the stage of project creation (I will show this later): Azure ThreadX and AWS FreeRTOS. The latter one is more widespread and well-known and is ported to a lot of different MCUs, but the ThreadX has a deeper integration into the RA ecosystem, so we will start with it.
Introduction into an RTOS
I think everybody has heard about “operating systems”. They are a sort of program which manages the hardware and software resources of some computing device (MCU, PC, smartphone, etc.). The most well-known operating systems are used by laptops and PCs: Windows, Linux, macOS; and by smartphones: Android and iOS. There are many more of them, and I mention only the most famous here.
So why do we need an operating system? It’s actually a very important part of a computing device. As I said before, it manages the resources of the device. Whether you open some file from the disk drive, or run a game, or watch a video on the Internet, or listen to music, or video chat with your friends, there is always an OS which stands behind these operations.
Without an OS there would be chaos on your PC or smartphone. Imagine the situation: you work in some office program, download some file from the internet in the background, and receive a video call. These simple everyday activities need to use the same hardware resources: CPU, hard disk, Ethernet card, sound card, video card etc. What would happen if every program tried to capture the resource and use it all the time? Certainly, nothing good. There would not be such a thing as multitasking at all - each program would grab all required resources and selfishly release them only when it’s done.
With the operating system, resources are shared between different programs using a special instrument called a “scheduler”. Each program inside the OS is divided into parts which are called “tasks”, and smaller parts - “threads”. Then the scheduler provides access to the common resource to each task or thread during some time which is defined by how things are scheduled. Each task or thread has its own priority, and the ones which have higher priority get access to the resource first and can hold it for a longer time.
So when you download some file from the internet and have the video chat, the OS provides access to the internet to these two tasks at the same time. As there is only one Ethernet card on the PC, the OS switches between these two tasks at a high frequency providing access to it to both tasks. For us, as users, this scheduling is hidden, so we consider that these two things are implemented simultaneously. This was just a short and simple example of what the OS does. In fact there are many more things for which it’s responsible. I will not provide you a lecture about all the OS basics here, I just want you to realize that in a complex system, using an OS is obligatory in almost all cases.
Now let’s consider what the difference is between the normal OS and RTOS. First of all, I should mention that all the operating systems mentioned above are not RTOS. Yes, it is a pitiful thing but we use them and don’t suffer too much at their hands.
RTOS are operating systems which provide a response to events within a determined time no matter what happens with the device. Let’s imagine some device that controls a gas station. If some fault happens, it should cut off the supply of the fuel within a very short time. If it ran in Windows, it could hang for some seconds opening a big file or making some hard calculation, during which the fuel leakage would continue and lead to an explosion. So in such systems, we need an OS which will put aside all the processes and respond to the alarm event within a very short time.
There are such systems for PCs as well, for example QNX, but most RTOSes are designed to be used on MCUs. This is because control systems are often based on the MCUs, because they provide the required GPIOs and interfaces which are absent in a typical PC. Also, even though it sounds weird, the MCUs can be faster than the PC. Yes, yes, even the tiny PIC10F200 can normally deal with 1 us pulses, while the PC can miss them because the smallest time quantum of the used OS is bigger than this value. If you write programs for Windows, you may know that implementing the sub-millisecond delay in it is quite a non-trivial task.
As I said before, one of the most widespread RTOS for MCU is FreeRTOS which is now part of the AWS ecosystem. There are also a lot of RTOSes specific for certain MCU cores because every self-respecting manufacturer tries to create its own RTOS and claim that it’s the best of the best. Well, in general, they all are very similar. Some of them have certain advantages for sure but that doesn’t mean that this makes them the best.
When selecting the hardware or software resource, you need to be guided by the principle: “The best thing is the one that you know”. So if you develop devices using the STM32 MCUs and FreeRTOS for 15 years, you (perhaps unwillingly) become an expert in them, so switching to something new will reduce your productivity and the code quality for some time. But, well, it’s just a lyric, let’s return to operating systems.
Introduction into Azure ThreadX
ThreadX is the RTOS designed in 1997 by the Express Logic company, which in 2019 was purchased by Microsoft, and since then became a part of the Azure ecosystem. Even though there is no prefix “free”, this OS is free, and moreover, open source. This means that the customer embeds the source code of the RTOS core into their own project and can change it as he wants. The core of ThreadX is mainly written in the C language with the small Assembly parts. You can read everything about ThreadX RTOS in the Microsoft official documentation: https://docs.microsoft.com/en-us/azure/rtos/threadx/. I will rely on it in this tutorial.
According to Microsoft, Azure ThreadX has the following features:
- Simple picokernel architecture, which plugs all the kernel functions inside the core, and thus increases the context switching speed and services performance.
- Automatic scaling. This means that you include into your code only those services that you will use. For example if you don’t use mutexes, you just don’t enable them, and thus save the memory occupied by the RTOS core. The minimal size of the RTOS kernel is just 2kB of flash memory, and 1kB of the RAM which makes it really tiny and applicable to be used even on small MCUs.
- Deterministic processing, which is actually included into the definition of the term “RTOS”.
- Fast real-time performance.
- Preemptive and cooperative scheduling. Preemptive scheduling means that the thread with the higher priority will preempt the thread with the lower priority. In cooperative scheduling the task is implemented until it’s done or is suspended by some blocker (about which we will talk later).
- Flexible thread priority support, which means that you can change the priority of any thread at any moment.
- Dynamic system object creation allows you to create the system objects not only at startup but dynamically when you need them.
- Unlimited number of system objects.
- Optimized interrupt handling.
- Preemption-threshold is an interesting feature about which I also talk later
- Priority inheritance allows to avoid such an unpleasant thing as priority inversion when the low-priority thread blocks the high-priority thread, and it can never become active again.
- Fast software timers. You can create the software timers and use them as usual threads which will periodically implement some action.
- Run-time memory management.
- Run-time performance monitoring.
- Run-time stack analysis.
- Built-in system trace which allows debugging the application using special program tools.
- Vast processor and development tool support. You can see the list of the supported devices here: https://en.wikipedia.org/wiki/ThreadX.
The main unit of the ThreadX RTOS, as even follows from its name, is “thread”. In this RTOS there is no such concept as a “task” or “process” like in other operating systems.
There are four types of program execution within a ThreadX application:
- Initialization, which includes the code implemented between the processor reset and starting the scheduler.
- Thread Execution is the main part. The scheduler searches for the implemented thread that is ready for execution with the highest priority and executes it. If this thread becomes suspended or finishes its task, then another thread that meets the requirements is searched for. The execution of the current thread can be interrupted by a thread with a higher priority.
- Interrupt Service Routines (ISRs) don’t differ from those in non-RTOS systems. Once an interrupt occurs, the execution of the current thread is suspended, and the ISR function is implemented. In this way, real-time operation is provided.
- Application Timers are similar to ISRs in meaning that they also interrupt the execution of the current thread. The difference is that they are part of the RTOS kernel, so their interrupt is the software one. Also, unlike the ISRs, the Application Timers can’t interrupt each other.
Thread Execution States
I think, I will just copy and paste this chapter from the Microsoft documentation because it’s described there very well, and doesn’t need any further clarification:
Understanding the different processing states of threads is a key ingredient to understanding the entire multithreaded environment. In ThreadX there are five distinct thread states: ready, suspended, executing, terminated, and completed. Figure 1 shows the thread state transition diagram for ThreadX.
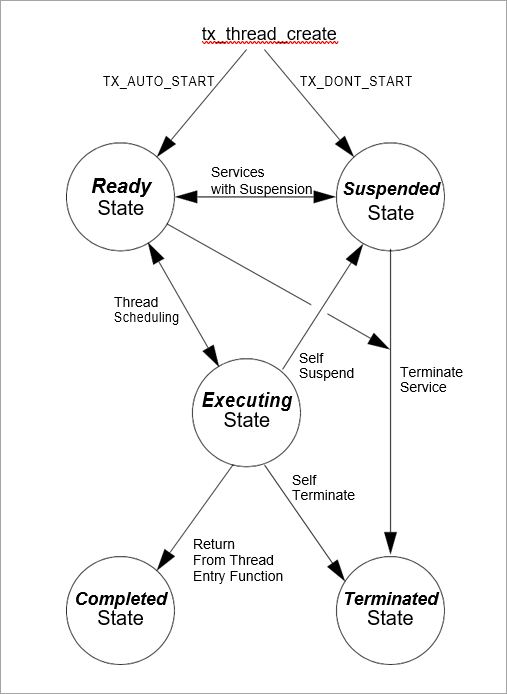
A thread is in a ready state when it is ready for execution. A ready thread is not executed until it is the highest priority thread in ready state. When this happens, ThreadX executes the thread, which then changes its state to executing.
If a higher-priority thread becomes ready, the executing thread reverts back to a ready state. The newly ready high-priority thread is then executed, which changes its logical state to executing. This transition between ready and executing states occurs every time thread preemption occurs.
At any given moment, only one thread is in an executing state. This is because a thread in the executing state has control of the underlying processor.
Threads in a suspended state are not eligible for execution. Reasons for being in a suspended state include suspension for time, queue messages, semaphores, mutexes, event flags, memory, and basic thread suspension. After the cause for suspension is removed, the thread is placed back in a ready state.
A thread in a completed state is a thread that has completed its processing and returned from its entry function. The entry function is specified during thread creation. A thread in a completed state cannot execute again.
A thread is in a terminated state because another thread or the thread itself called the tx_thread_terminate service. A thread in a terminated state cannot execute again.
Important! If re-starting a completed or terminated thread is desired, the application must first delete the thread. It can then be re-created and re-started.
OK, I think that's enough theory for today. Let’s now try to create the Azure ThreadX based RA project.
Creation of the Azure RTOS ThreadX Project in the e2 studio
Let’s open e2 studio and start creation of the new project in the way I described in tutorial 2. Let’s call it “threadx_blinky”. On the step 3 “Build Artifact and RTOS selection” select the Azure RTOS ThreadX (v.X.X.X+fspY.Y.Y) (Figure 2).
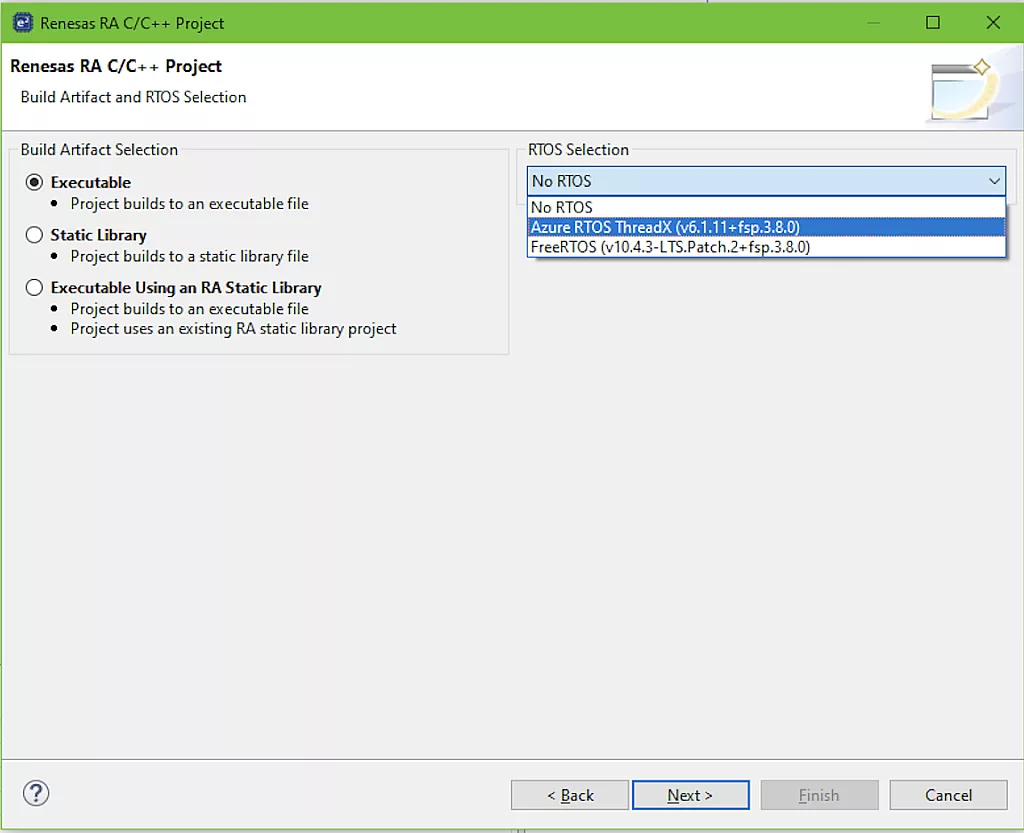
As you can see, at the moment of writing this tutorial the current version of the ThreadX port is 6.1.11, and the current version of the FSP is 3.8.0.
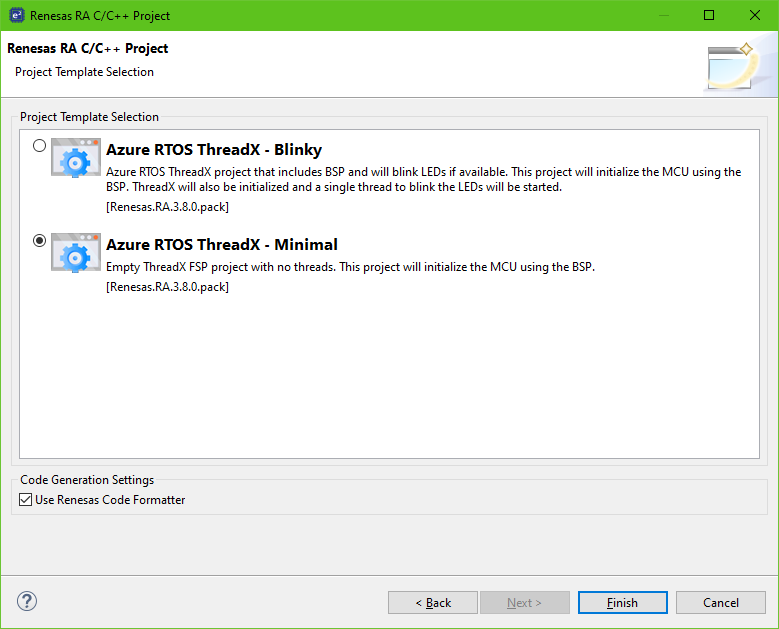
In the next step, select the “Azure RTOS ThreadX - Minimal” template and click the “Finish” button (Figure 3).
In the opened FSP configuration window we need to switch to the “Stacks” tab and make sure that now we have the “Azure RTOS ThreadX Port (rm_threadx_port)” stack in the HAL/Common thread (Figure 4).
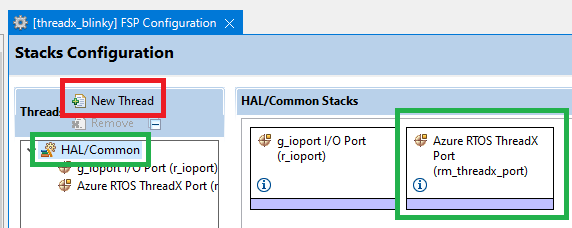
This block doesn’t have any properties that can be changed. To run the application with the RTOS we need to have at least one thread in it. So let’s click the button “New Thread” (Figure 4).
When we click on the “New Thread” point, we will see a huge number of options (Figure 5). Let’s now try to understand what they mean.
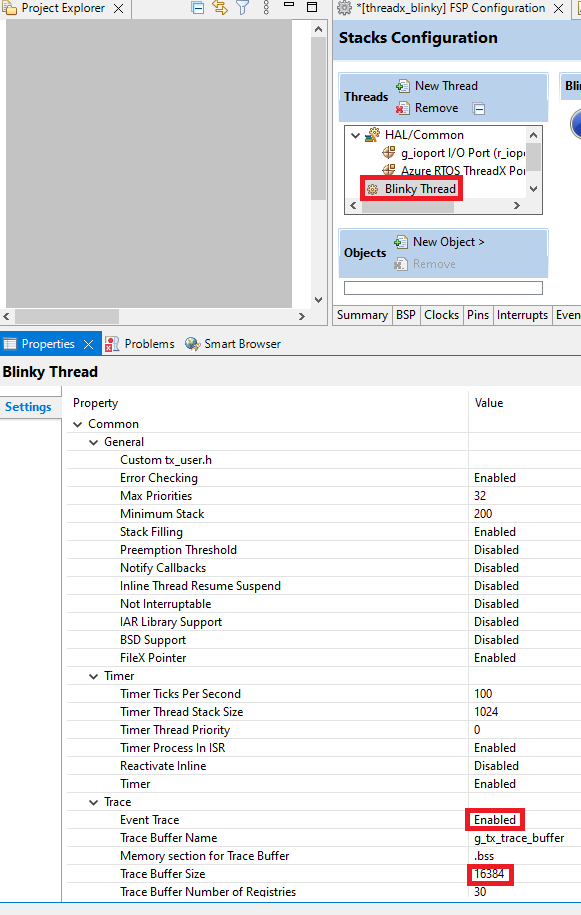
In my explanation of the properties I will rely on this page: https://renesas.github.io/fsp/group___r_m___t_h_r_e_a_d_x___p_o_r_t.html.
- “Custom tx_user.h” allows us to replace the auto-generated file “tx_user.h” which is used to configure some RTOS settings. We are not going to do this so we leave this field blank.
- “Error Checking” enables or disables checking the errors by the native ThreadX API.
- “Max Priorities” sets the maximum number of the thread priorities. This number can be up to 1024. But you need to consider that every 32 priority levels require an additional 128 bytes of the RAM. As we will have only one thread in our project let’s leave the minimum possible value of 32.
- “Minimum Stack” sets the minimum stack size for a ThreadX thread in this system. If your thread is quite complex and uses a lot of nested functions, you may need to increase this value. But never decrease it, as for this MCU this value is the minimal possible. So we leave it 200.
- “Stack Filling” is a useful function for the debugging purposes. If it’s enabled, then all the unused stack bytes are filled with the byte 0xEF. This helps to control the stack with the debugger.
- “Preemption Threshold” is an interesting feature of ThreadX which helps to prevent priority inversion. It allows setting the threshold of the priority, and the threads with the priority lower than this threshold will not interrupt the execution of the current thread. This option requires some additional resources and reduces the productivity, so when not used, it is better to be disabled.
- “Notify Callback” allows to enable the callbacks which notify about different system events. We won’t use this option for now, so let’s leave it as disabled.
- “Inline Thread Resume Suspend”. If this option is enabled then the thread resume and suspend services have their internal code inline. This increases the program size but also increases productivity.
- “Not Interruptible” determines if the internal ThreadX code is non-interruptible. This results in smaller code size and less processing overhead, but increases the interrupt lockout time.
- “IAR Library Support” should be enabled when used with the IAR compiler. Once we use the GCC in the e2 studio, we need to disable this option.
- “BSD Support” enables support of the BSD functions which we also don’t need for now.
- “FileX Pointer” determines if there is a FileX pointer in the thread control block. By default, the pointer is there for legacy/backwards compatibility. The pointer must also be there for applications using FileX. Disable this to save space in the thread control block. FileX is the ThreadX based service that operates with the file system, we will consider it later in one of the next tutorials.
- “Timer Ticks Per Second” sets the number of the main kernel timer ticks per second. The default value of 100 sets the minimal time quantum as 10ms.
- “Timer Thread Stack Size” sets the stack size for the timer thread.
- “Timer Thread Priority” sets the priority of the timer thread. The default value is 0, which is the highest priority, that gives the timer thread an opportunity to interrupt any thread.
- “Timer Process in ISR”. If this option is enabled then all timer-related things (like application timers, timeouts etc.) are implemented directly inside the timer ISR which eliminates the timer thread control block, stack, and context switching to activate it. If this option is disabled all the timer-related things are implemented inside the timer thread.
- “Reactivate Inline” determines if in-line timer reactivation should be used within the timer expiration processing. By default, this is disabled and a function call is used. When enabled, reactivation is performed in-line resulting in faster timer processing but slightly larger code size.
- “Timer” enables or disables all the timer processing.
- “Event Trace” enables or disables the tracing of the RTOS events. This option should be enabled when the TraceX tool is used for debugging code. Let’s enable it, as I’m going to show you how to use this tool.
- “Trace Buffer Name” is the name of the buffer where the tracing information will be stored. We can leave the default name
- “Memory Section for Trace Buffer Name” is the memory section in which the trace buffer will be allocated. The “.bss” section is located in the RAM, so we leave this value unchanged
- “Trace buffer size” sets the trace buffer size in bytes. As the RAM size of the MCU in the EK-RA2A1 is just 32kB, let’s decrease this value to 16384.
- “Trace Buffer Number of Registers” is the number of registers available to TraceX. Here we will also leave the value at default
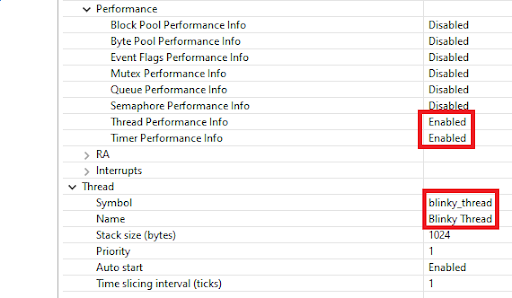
- All fields inside the “Performance” list are used to gather the performance info of the corresponding service. We can enable the “Thread Performance Info” and “Timer Performance Info” as the rest of services are not used in this project.
- “Hardware Thread Stack Monitoring” uses RA Hardware Stack Monitors to monitor thread stacks for overflow.
- “SysTick Interrupt Priority” sets the priority of the SysTick timer interrupt.
- “Maximum Interrupt Priority” sets the highest interrupt priority that can be set to the scheduler services. If this value is 0, then the timer can’t interrupt the threads with the equal priority.
- “Symbol” sets the name of the thread under which it’s known in the program code. Let’s call our thread “blinky_thread”.
- “Name” sets the name of the thread. We can change it to the “Blinky Thread” and notice that in the “Threads” list the name of the thread also has changed.
- “Stack size (bytes)” sets the stack size for the current thread.
- “Priority” sets the priority of the current thread. This value should be in the range from 0 to “Max Priorities” - 1. The lower the value - the higher the priority.
- “Auto start” enables or disables the auto start of the thread after creation (see Figure 1). If this option is enabled, the thread will be in the ready state after creation, otherwise it will be in the suspended state.
- “Time slicing interval (ticks)” sets the minimum time interval in ticks (10 ms in our case) during which the thread will be executed without the scheduler intrusion unless an interrupt occurs. After this time, the scheduler checks if there is any thread with the same priority ready for execution and switches to it.
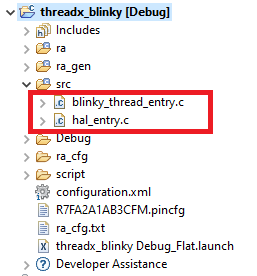
So, as you see, we don’t change anything for now in the default configuration except for the thread name and symbol which actually were optional as well. Now let’s press the “Generate Project Content” button to let the FSP configurator create the required files. After that, in the “src” folder of your project you will see two files: “hal_entry.c” which always is present there, and the new “blinky_thread_entry.c” (Figure 6).
Writing the Program Code
We used to write the program code inside the “hal_entry.c” in the non-RTOS application but with using the RTOS we will now write the code in the thread-related files. In our case we have a single thread, and thus only one source file that corresponds to it. So let’s now open the “blinky_thread_entry.c” file and see its default content (Figure 7).
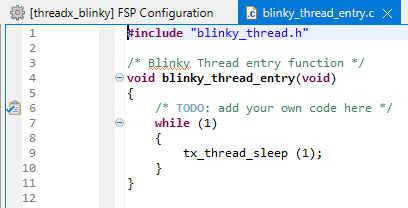
In line 1 we include the “blinky_thread.h” file which consists of the required includes, macro definitions, and function declarations.
In lines 4-11 there is the blinky_thread_entry function which is the body of the thread. As the usual function it has the initialization part and the infinite loop (lines 7-10). If for some reason we leave the loop, the thread will switch to the “completed” state (Figure 1) and stop running forever.
Inside the loop there is now only one function tx_thread_sleep which puts the thread into the “suspended” state (Figure 1) for the specified number of ticks. As you remember (Figure 5), in our case one tick is 10 ms. We can use this function to implement the delay: first we implement some action, and then invoke tx_thread_sleep which will suspend the thread for some time. After this time is expired, the thread becomes ready again, and as there are no concurring threads, it will execute immediately.
Let’s now add some code into this thread which will toggle the LED1 on the board.
#include "blinky_thread.h"

#define BLINK_DELAY 	50   //Delay in timer ticks units (10 ms)
extern bsp_leds_t g_bsp_leds;     //Structure with all the LEDs of the boards

/* Blinky Thread entry function */
void blinky_thread_entry(void)
{
    bsp_io_level_t pin_level = BSP_IO_LEVEL_LOW;
    while (1)
    {
        R_BSP_PinAccessEnable(); 	//Enable access to the GPIO registers
        R_BSP_PinWrite(g_bsp_leds.p_leds[0], pin_level);//Set the new pin level
        R_BSP_PinAccessDisable();	//Disable access to the GPIO registers
        pin_level ^= BSP_IO_LEVEL_HIGH; //Toggle the pin level
        tx_thread_sleep (BLINK_DELAY); //Suspend the thread for the specified time
    }
}
In line 3 we define the BLINK_DELAY macro which specifies the number of timer ticks during which the project will be suspended.
In line 4 we declare the g_bsp_leds structure which contains the information about all LEDs located on the board. Actually, this structure is declared in the “board_leds.c” file, that’s why we use the modifier extern before the declaration.
In line 9 we declare the variable pin_level which represents the current LED state and assign it with the BSP_IO_LEVEL_LOW value which, as follows from its name, corresponds to the low pin level.
In lines 10-17 there is the infinite loop in which the main body of the thread is executed.
In line 12 we enable the access to the GPIO registers. In line 13 we set the new level of the first LED on the board (my board has a single user LED). In line 14 we disable access to the GPIO registers. In line 15 we toggle the pin_state value using the XOR operation with the BSP_IO_LEVEL_HIGH value. Finally, in line 16 we suspend the thread for 500 ms.
Now, as we have written the code, we can build the project, make sure there are no errors, connect the board to the PC and start debugging. You should see LED1 blinking with the frequency of 1 Hz (500 ms on, 500 ms off).
Using the RTOS Resources View
This built-in tool allows you to see the statistics of the RTOS usage. In my description of it I will stick to this application note: Azure RTOS TraceX for Azure RTOS ThreadX Debugging.
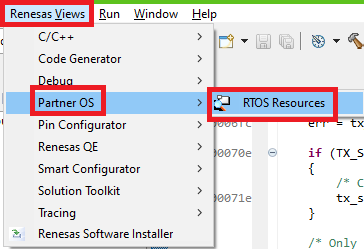
To run this tool we need to select the point “Renesas Views” in the main menu, then “Partner OS”, and finally “RTOS Resources” (Figure 8).
Pause the debugging and see that in the RTOS Resources you can now select the OS. Please choose “ThreadX” in the drop-down list (Figure 9).

Click the “OK” button. Then resume the execution of the application and pause it again. You will see that the “Blinky Thread” has appeared in the “Thread” tab (Figure 10).

As you can see in Figure 10, there is the comprehensive information about the thread. Also you may notice other tabs which display the information about other resources. To gather the information about them you need to enable the corresponding “Performance Info” (Figure 5) in the thread settings.
Here you can also gather information about the used stack. To do this, pause the project, and click the “Stack settings” button in the right of the “RTOS resources” name (Figure 11).

In the opened window select the “Enable loading Stack data” checkbox and also set the desired Stack Threshold after which you will receive the warning (Figure 12).
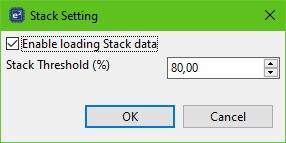
Click the “OK” button and switch to the “Stack” tab. You will see the information about stack usage of the Blinky Thread (Figure 13).

There are also other buttons to the right of the “RTOS Resources” name (Figure 11) which allow you to set the auto updating settings, update the information manually, save the information to file or select the OS again. I will not consider them in detail as they seem to be quite clear. If something is still dim, you can refer to the application note mentioned above.
Debugging the Application using TraceX tool
Microsoft provides the TraceX tool which allows debugging the TraceX-based application. In this tool you can see the states of the threads and the RTOS services in the graphical view. Unfortunately, you can’t do it in real time, just see the saved data. In my description I will still refer to the same application note Azure RTOS TraceX for Azure RTOS ThreadX Debugging.
First we need to install the TraceX tool. To do this we need to go to the TraceX page of the Microsoft store and install it from there.
Now, prior to running TraceX we need to extract the information based on which it will make the pretty diagram of the project operation. As you remember, when we configured the thread, we set the Trace parameters, particularly, the “Trace Buffer Name”, which in our case is “g_tx_trace_buffer” (Figure 5). Keeping in mind this information, let’s start the debugging of the project, and after a few seconds, pause the execution of the program. Now let’s switch to the “Expressions” window. If you don’t see it, click on the “Window” in the main menu, expand the “Show View” list and find the “Expressions” point (Figure 14).
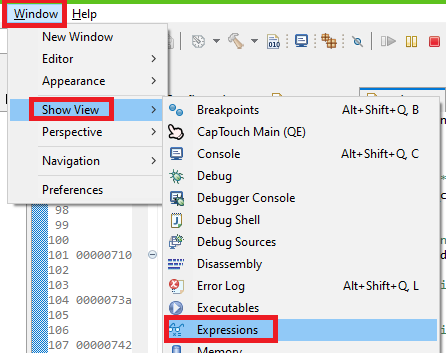
In this window, click on the “Add new expression…” and type “g_tx_trace_buffer”. Now we need the address of this buffer (Figure 15).

And now we will need to export the content of the buffer into the file which will later open in the TraceX tool. To do this, open the “Memory” window. If you don’t find it, click the “Window” in the main menu, then expand the “Show Views” list and find “Memory” (Figure 16).
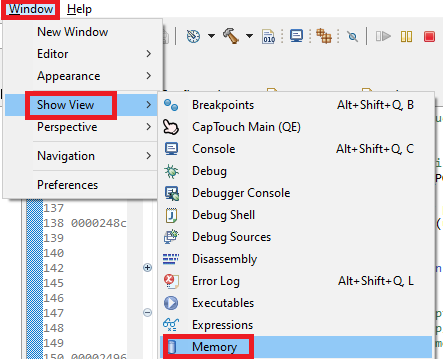
In the “Memory” window click on the green plus button and in the opened window write in the address of the “g_tx_trace_buffer” from Figure 15 and click the “OK” button (Figure 17).

When you see the content of the buffer, press the “Export” button at the right of the “Memory” title (Figure 18).

In the opened window, select the “Format” as “Raw binary”, then make sure that the “Start address” field corresponds to the “g_tx_trace_buffer” address, change the “Length” field to the value that you mentioned in the thread settings (Figure 5) (in our case it’s 16384). Then select the “File name”. The extension of the file should be “.trx” but the name and location can be anything (Figure 19).
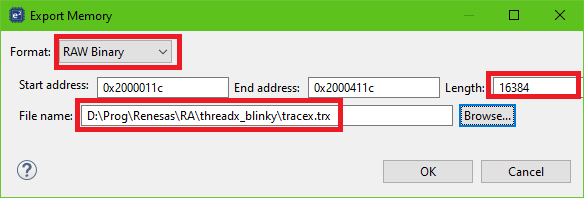
Click the “OK” button to finish exporting.
Now we can put aside e2 studio and open the “Azure RTOS TraceX” application. In the main window click the “Open file” button and select the recently created file (in my case “tracex.trx”). You will see the following diagram (Figure 20).
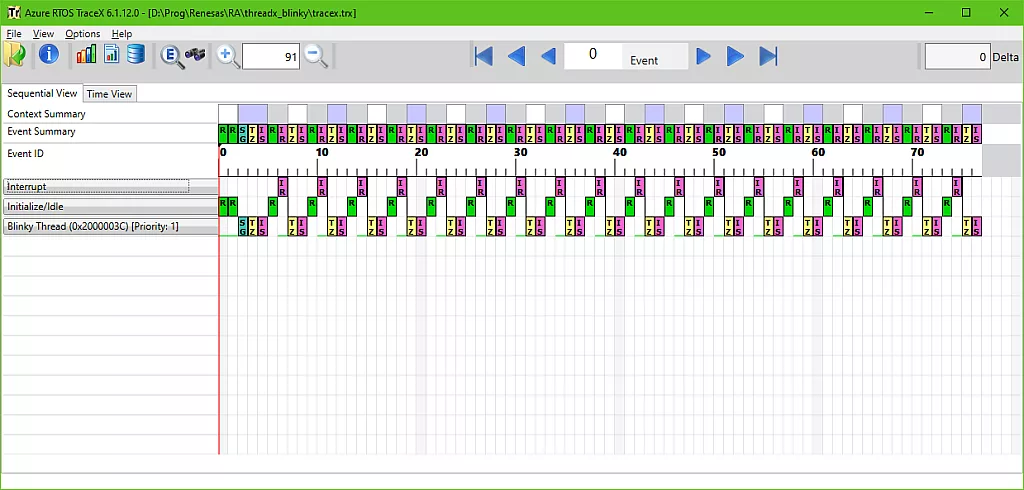
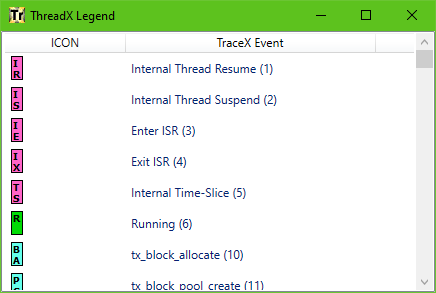
Here you can see the operation of all the services and threads of the application. To understand what these colorful rectangles mean, select the “View” in the main menu and click on the “ThreadX Legend” point. You will see the explanation of all the rectangles (Figure 21)
Also you can select “Help” in the main menu and click on the “Manual” point. This will open the Microsoft site with the detailed description of the TraceX tool: https://docs.microsoft.com/en-us/azure/rtos/tracex/.
Actually, I will not describe in detail how to work with this tool, you can manage this by yourself using the above-mentioned page. Instead let’s consider Figure 22 more thoroughly to see what happens in our application from the RTOS perspective.
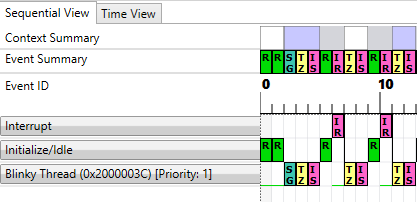
As you can see there are three rows:
- Interrupts, which represent the system interrupts.
- Initialize/Idle which actually speak for themselves.
- Blinky Thread, which is the thread that we have created, and in which the LED blinking is implemented.
If you hold the mouse above any rectangle, you can see the detailed explanation of what it is (Figure 23).
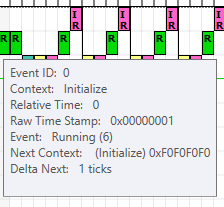
As you can see, this is the “Initialize” event. The same as the next one. The third event marked as SG (Figure 24) is “Semaphore Get”. We didn’t consider the semaphores yet and didn’t use them explicitly but it seems like the FSP does some tricky things with our thread.
The next four events repeat continuously (Figure 20, 22) and represent the changing state of the thread. The TZ event means calling the “tx_thread_sleep” function after which the IS event occurs which means “Internal suspend”. After, this the thread becomes suspended, and as there are no other threads, the system becomes Idle, which is represented by the R event in the “Initialize/Idle” row. After 500 ms the interrupt occurs which causes the event IR “Internal Thread Resume” after which the thread becomes ready. And the next event is TZ again. For some reason, I don’t see the event when the current thread executes but this action probably doesn’t cause any event which is weird for me.
Anyway, in the current project we have only one project, and it’s simple to understand what happens in it. And imagine that you have about ten threads which interact with each other and mutually block each other. Such things are very hard to check, and in this case the TraceX tool may be very helpful. In further projects I will use it and show you what happens with the threads in the application.
And that’s all for now. This tutorial surprisingly became unexpectingly meaty, so it’s quite a lot of information for you to grasp.
The next time we will start the consideration of the thread synchronization services: semaphores and mutexes.
As homework, I suggest you consider the TraceX tool in more detail and study all its possibilities.

Get the latest tools and tutorials, fresh from the toaster.


